Superannuation FUM & Membership Optimisation

Data Integrators deliver key analytical data driven processes to identify common Superannuation Industry areas where administration improvements are essential to grow membership and FUM:
-
 Are your organic fund growth and contributions masking the impact of member rollouts?
 -
 Are your fees in line with the rest of the industry?
 -
Can your fund easily identify the effect of member rollouts on operational revenue impacts?
-
Can your fund identify when the membership base is targeted by other funds?
-
Does your data identify simple membership segmentation with risk profiles?
Data Integrators deliver improvement solutions by optimising the following key data driven decision-making:
-
✓ Data analytics will identify the relationship between member rollouts and operational revenue impact and assist in steps to correct the impact.
-
✓ Fee analysis breakdown will clearly distinguish where your member’s fees are compared to the industry.
-
✓ Identify active targeting of your membership and activate steps to reduce rollouts.
-
✓ Identify members at risk and the FUM that will be affected by their rollouts.
-
✓ Apply simple membership segmentation with aligned risk profiles to assist with your next marketing campaigns.
-
✓ Design strategic imperatives to protect FUM and memberships.
-
✓ Adding key data markers to assist funds with early identification of normal and abnormal membership events.
-
✓ Add analytical driven reporting to underpin financial accounting reporting of FUM to measure core KPI and membership number movements.
-
✓ Provide guidance and expertise to uplift and train operational staff to future proof FUM and membership stability.
Each of the identification and data support areas, solutions are tailored and designed to fit your specific Superannuation fund. There is no ‘one fit for all’ and that is where Data Integrators experience stands out to work with your teams to design the best-fit improvement solutions for your fund.
Membership abnormal events… how does this impact your fund
-
a) How do you identify key historical abnormal membership movement and how that have had a NEGATIVE $ impact on your fee revenue 6 to 12 months later?
-
a) How do you identify current membership movements to determine the health of your fund before you see the NEGATIVE $ impact on your fee revenue 6 to 12 months later?
Data Integrators can assist your fund to review your historical events and identify key event driven triggers that will guide the decisions for corrective actions when abnormal events are identified.
Fund analysis – Case Studies
The following are some typical examples of optimisation opportunities identified by Data Integrators on Superannuation funds:
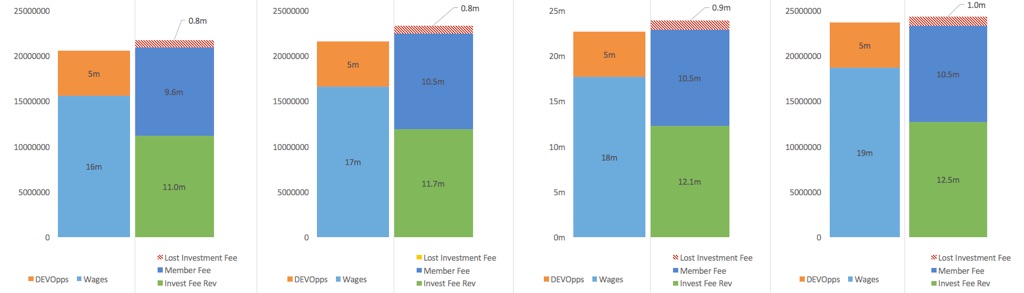
Data Integrators analysed the loss of revenue from members rolling out and for the fund we were working with at the time. The results stood out for the targeting being conducted by other funds.
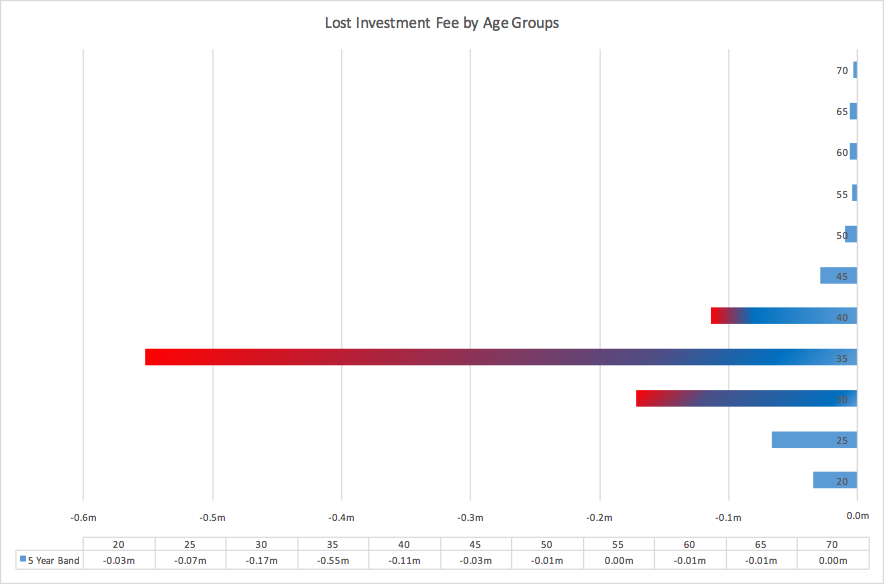
Fee erosion impacted by membership targeting while FUM financial reporting showed no cause for concern.
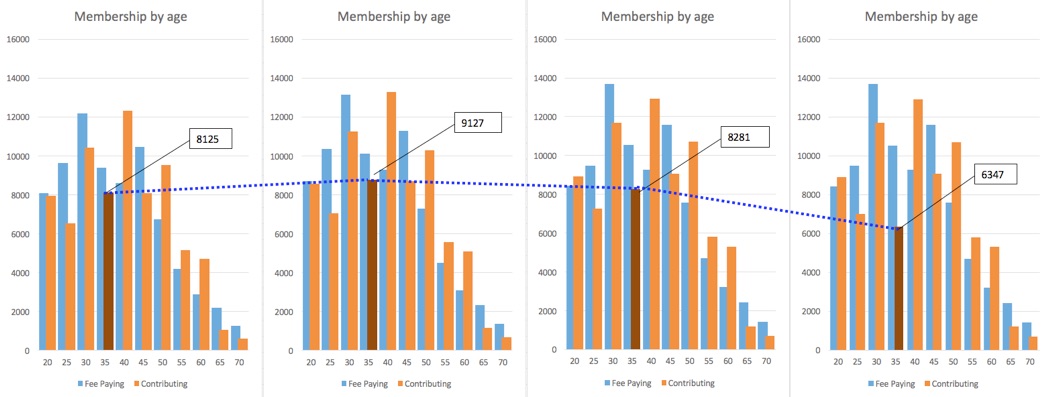
-18 months -12 months -6 months Current
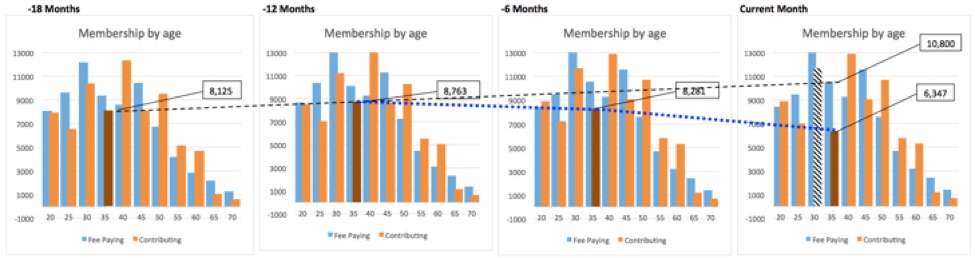
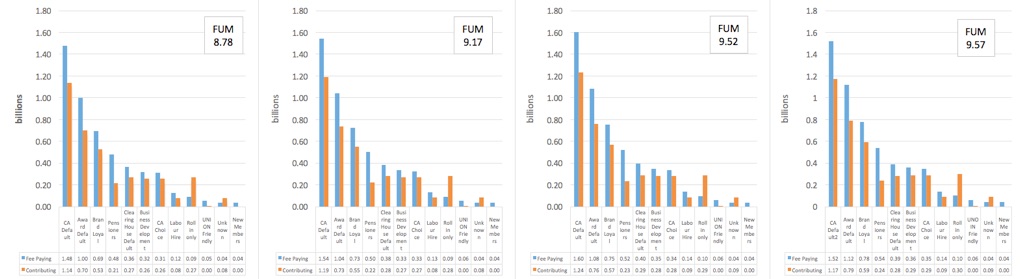
35-year age group membership segment was targeted 1 year ago and while the FUM segments contributions breakdown show FUM increase, the fund lost a large portion of 35-year old membership but this loss is not evident in current financial reporting.
Here over time the FUM increase and is not showing any indication of members lost eroding the underlying fee revenue also being lost.
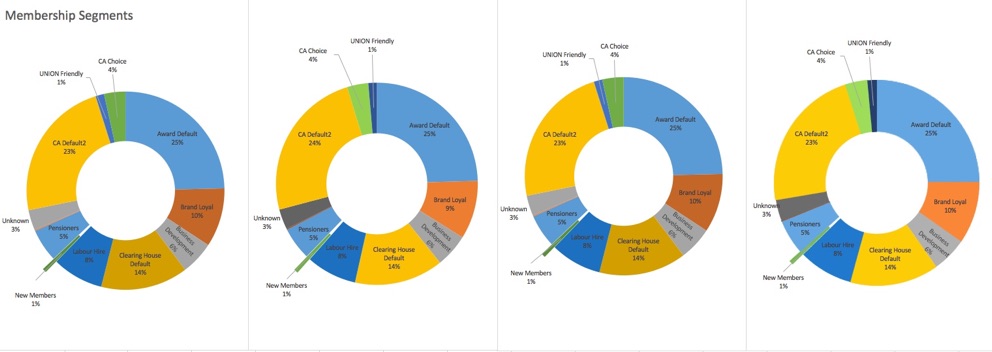
Over the same reporting period there were no significant change in membership segmentation to indicate membership losses.
-18 months -12 months -6 months Current
8,763 members - 6,347 members = 2,416 lost contributing members in 12 months.
This membership loss equated into a substantial “Investment Fee” loss, which were not evident in any of the financial reports.
-18 months -12 months -6 months Current
As shown above, the 35-year age group should have had memberships at normal levels of ~10,800, but that was not the outcome.
The bigger concern now is the next target group! The 30-year age group is next in line… (As shown above)
Data Integrators experience can work with your teams to identify historical and current events to guide decisions to minimise negative impacts in the future.
A. What has happened in your fund in the past and what was the $ impact?
B. What is happening right now and what is the possible projected $ impact if you do nothing?
C. Do you know the time lag when your fund see the $ impact after an event has occurred?
D. Would your fund want to have the analytics enabled on your own data to detect abnormal events?
Data Integrators can quickly and effectively identify the required trigger points using your own fund’s data by applying the right analytical analysis. This can all be done in parallel with your current day to day operations and should not impact your current in-flight projects or operations
Talk to one of our sale consultants about how we can help your fund be more competitive today.